The last six months have been a real test of endurance for businesses. One thing that has become evident to many business leaders is that having easy access to organizational data is essential to survival. Companies who can quickly access critical information and are made aware of changes as they happen are the ones who can flex, change, innovate and find a way forward in the most challenging times.
Business intelligence (BI) solutions like Sage Enterprise Intelligence provide a set of tools that help companies of all sizes pull data from disparate systems and prepare it for analysis and reporting. BI continues to evolve and can deliver more insight than ever through various advanced features and capabilities that enrich decision making. We’ve highlighted some of the most notable below.
1. One central hub for all data insight
Serving as a central hub for all data sources, the Universal Data Models make it easy to consolidate and access large amounts of data and turn that data into actionable insights for smarter business decisions. Universal Data Models for Finance, Sales, Inventory and CRM provide hundreds of KPIs that adhere to reporting standards.
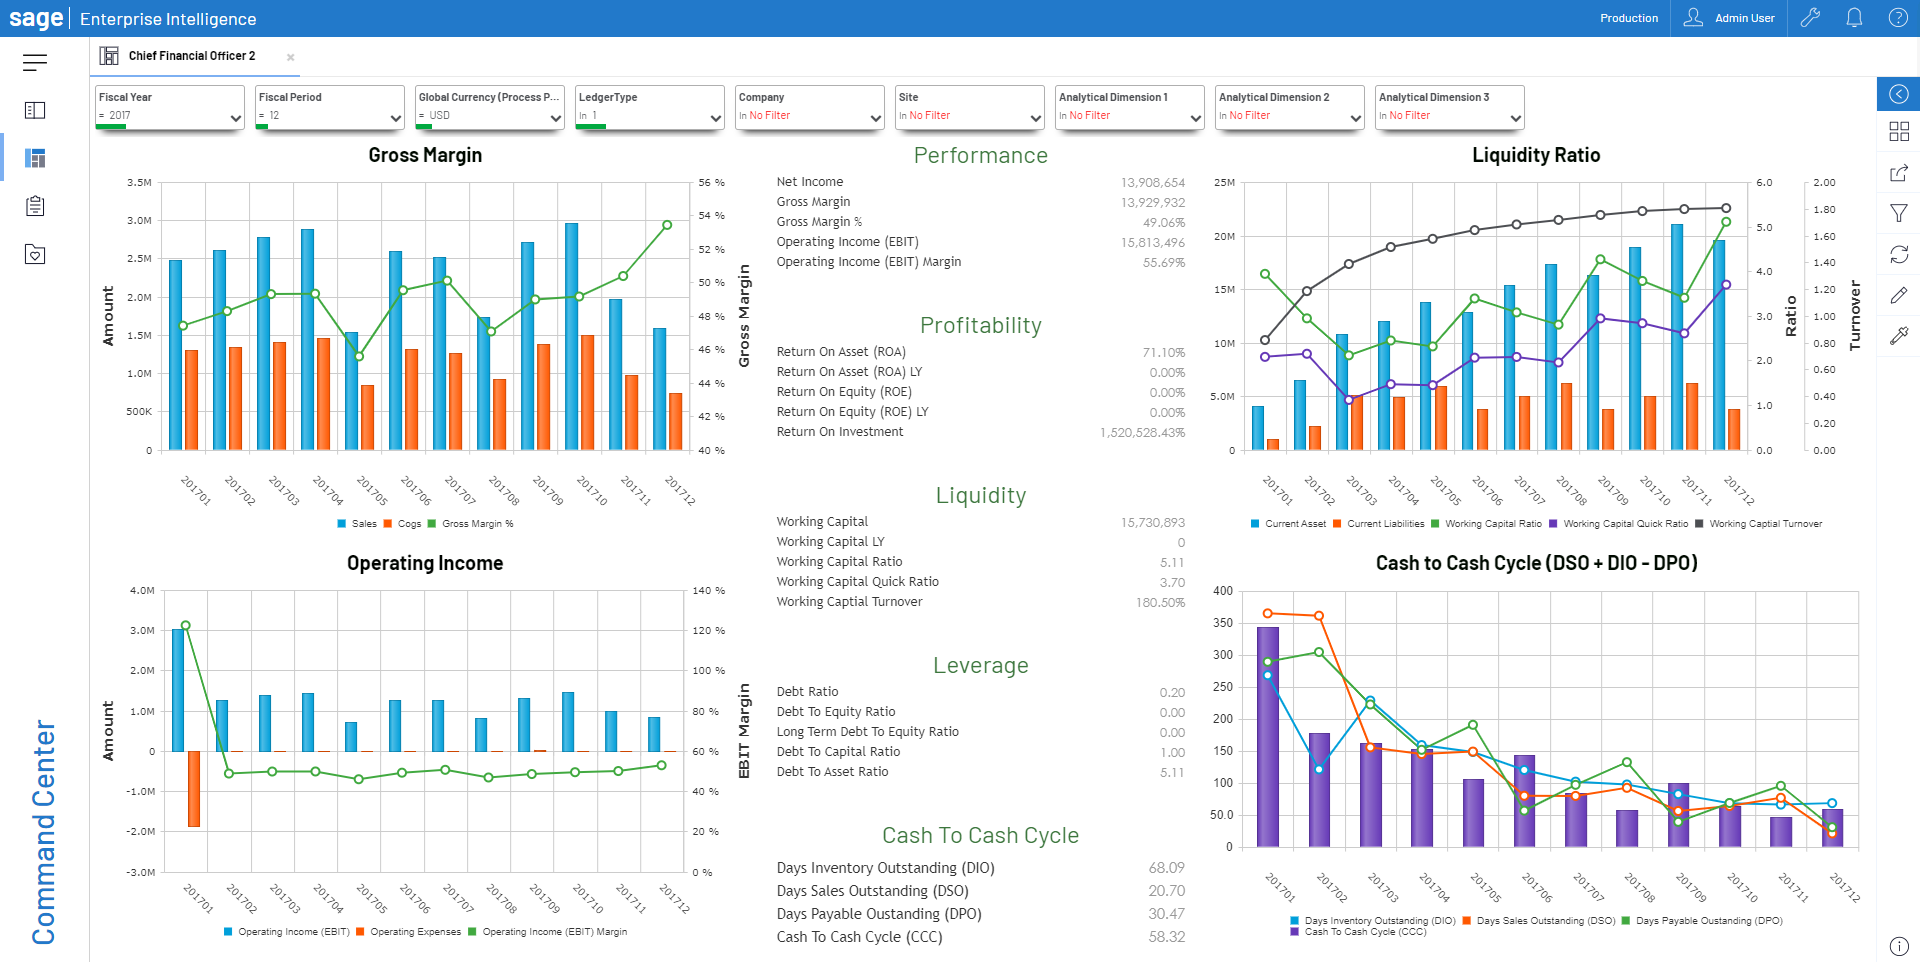
Whether you use the predefined dashboards and reports, or choose to create your own, with the Universal Data Models, you’re equipped with everything you need to analyze your enterprise’s activities, performance, and profitability. The Universal Data Models require minimal set-up and can help boost your company’s performance from the day you start working with Sage Enterprise Intelligence (SEI). This means that you can pull multiple business ERP systems, silos of data and business applications into one central hub alongside your Sage 300 data for an enterprise-wide view of your organization.
2. Timely distribution of intelligence
SEI’s distribution module comes with a suite of collaboration tools to help you share the right information between team members, business partners, and suppliers. Once your report is created, you can add team members to your distribution list and send to each member in the language of their choice. You can also decide what information each member will be able to access from this report. With automatic distribution you get access to advanced features such as conditional alerts, translations, data security, reporting pack, and more.
Distribute multiple reports in a single reporting pack that includes a cover page and a table of contents. For example, if you want to share several reports with your CFO, rather than sending her each report separately, you can send her all the reports in one email.
3. Self-service BI
SEI is available through a user-friendly web and mobile application and a much beloved Excel add-in. SEI was built with the goal to empower all employees within an organization, technical and non-technical, and to remove the barrier of relying on IT to provide daily users with the reports they need to do their jobs. Here’s a sample of some of the key outputs in SEI.
Worksheets
Manipulate your enterprise data with easy-to-use features such as filters, pivots, ranks, KPIs, and much more.
Charts
Analyze your data in the most efficient and meaningful way, with over 100 types of visualizations and more that we’re working on.
Dashboards
Get the big picture, with multiple view types from multiple data sources that all work together seamlessly.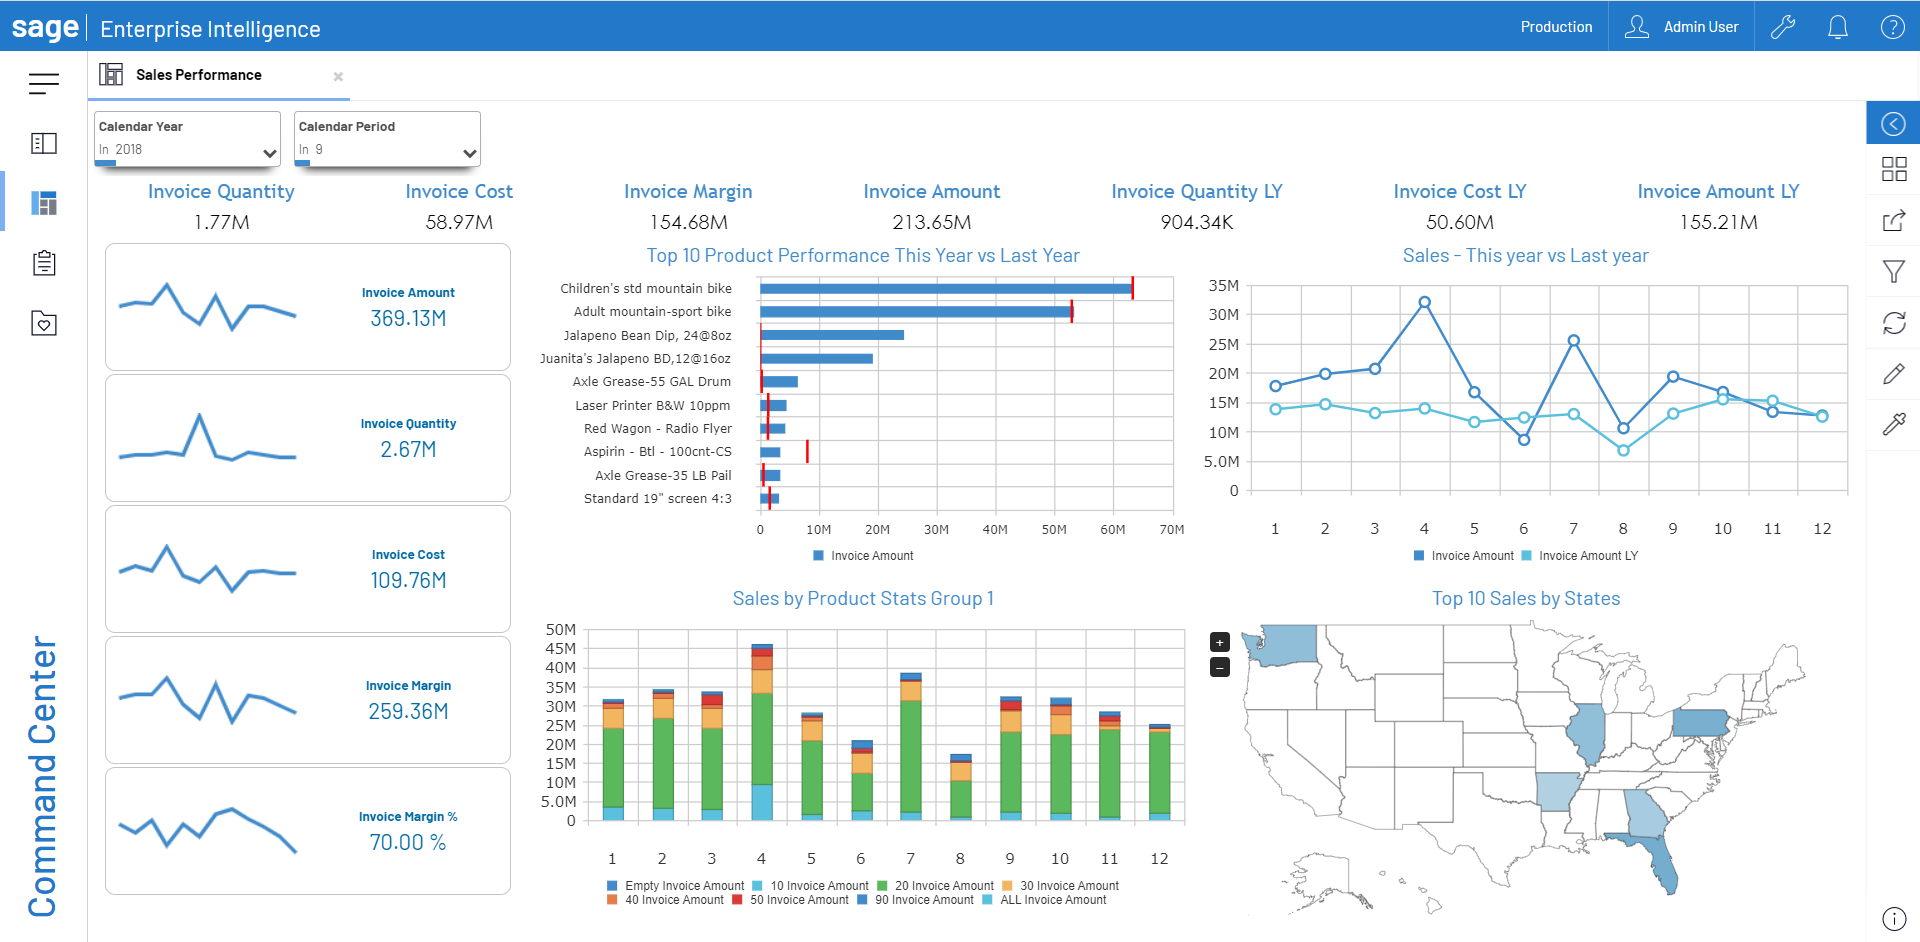
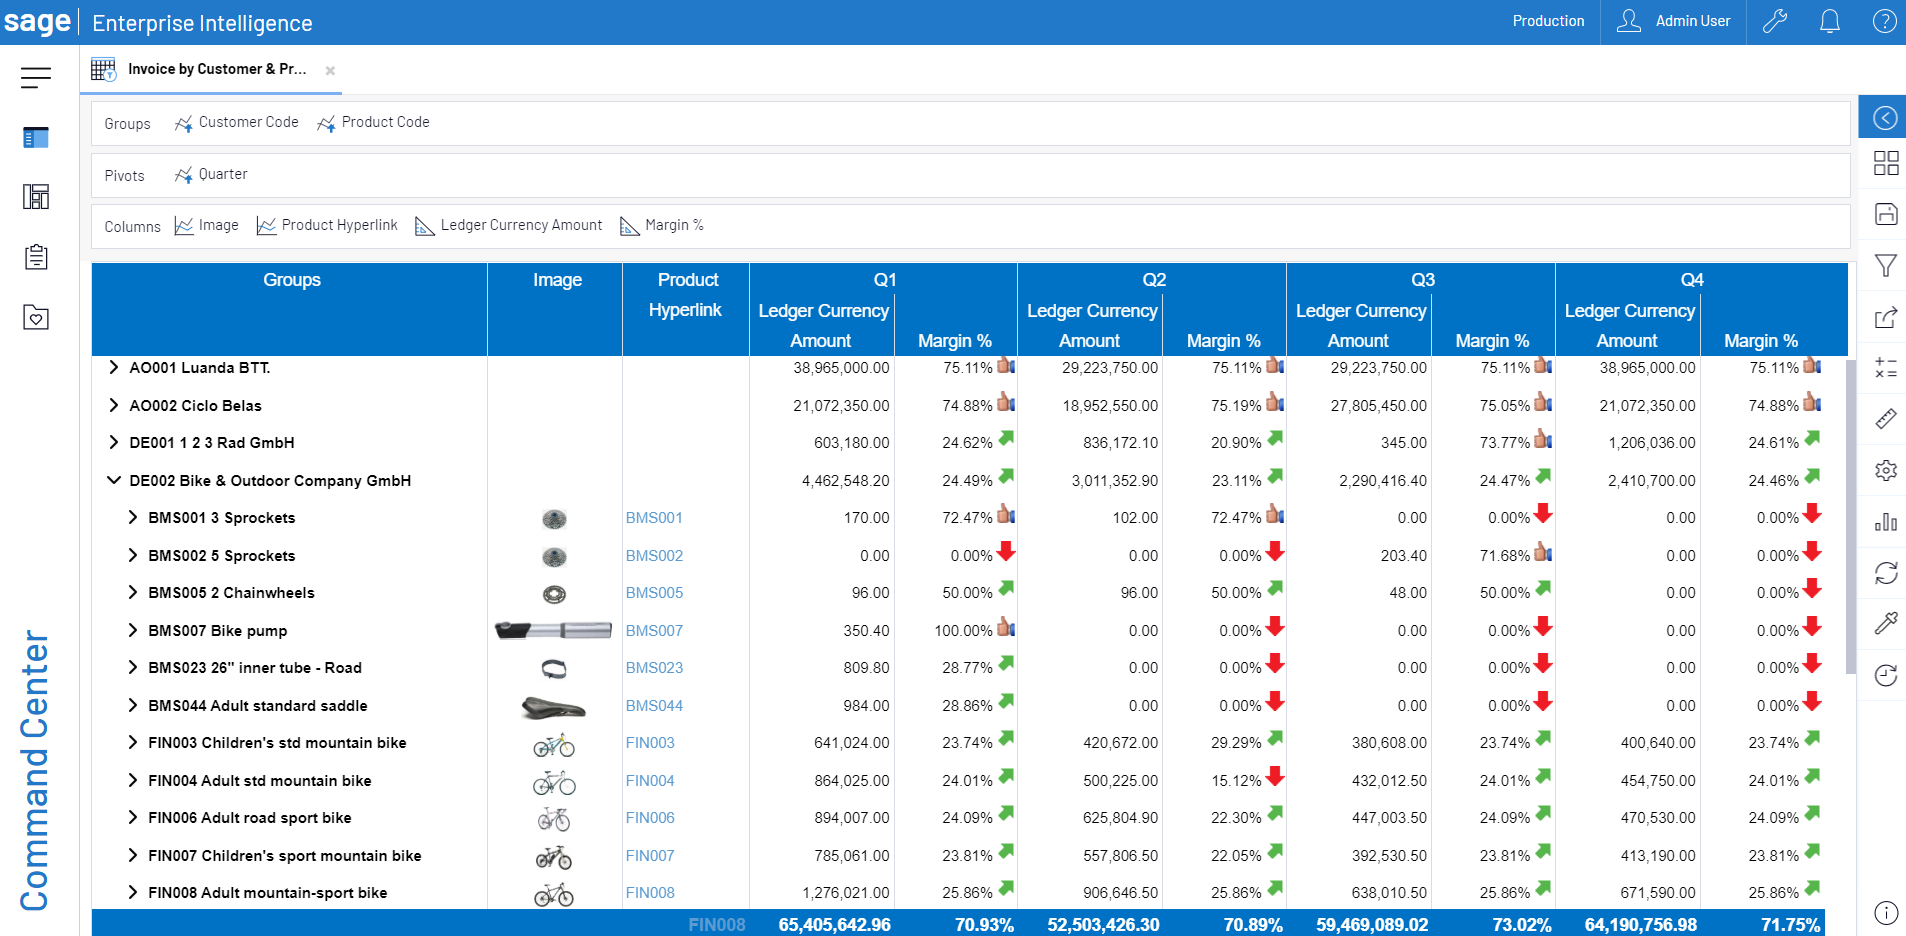
Reports
Flexible web reporting with advanced calculations, customization, and consolidation options.
Excel add-in
The analytical capabilities of Excel combined with the power of SEI’s data models, for access to your data in real-time.
4. Sales forecasts and budgets made easy
To properly analyze a company's sales, you need to compare its actual sales with the sales objectives that have been set. The Sales Forecast module was created to help you perform this task more easily.
With SEI you can manually modify or add data to help you manage Budgets, Forecasts, or other business areas where quick data entry is needed. This can be done easily by selecting the field or value you’d like to add or edit and then overwriting the value in that field.
5. And more cool features
Adding hyperlink and images: To add more details to any worksheet, you can include images of products and hyperlinks to web pages. This can help especially when non-descriptive product codes are used in your reports.
Historical aging and reporting: Most of the time, when you run your A/R aging report it’s to see the report as of the current moment. With the historical aging report, you can see what the A/R aging report looked like in the past, whether it’s one week or one year ago.
Deferring updates: Typically, when making any changes to a group, a pivot or a dimension in a worksheet, the data will be refreshed with every change. This can cause delays when it’s not necessary to update the data. By selecting to defer updates, you can build and change the layout of your worksheet as you like. Once you have made all your changes, you can remove the defer update option and your data will be refreshed.
How to unlock the power of business intelligence with SEI and BAASS
Each of these business intelligence tools are available in Sage Enterprise Intelligence and with a small amount of effort and investment to get Sage 300 users up and running.
Contact BAASS to learn more about the latest reporting, analytics, and insight tools you need to make key business decisions.